
Bitcoin after the September CPI: what I'm actually watching

THE WEEKLY READ
October 19, 2026 · Bitcoin · US 10-year · TOTAL3
Hi, I'm Chris. I got into crypto eight years ago. Four years in a row, I finished positive by reading my own charts. Then I started following a guru's calls instead of doing my own work, and I lost 33% of my account. ChartLab is the method I went back to. Past results are not a promise of anything, mine included.
This blog is where I show my work: real charts from my own TradingView, dated, with my levels on them. No signals. Just how I read the market, so you can learn to do it yourself.
What happened last week
CPI 3.7% vs 3.6% expected
Core 2.6% vs 2.5% · BTC low around $81,500 · PPI 6.3% the next day
On Wednesday, October 14, the US September CPI came out at 3.7% year over year, against 3.6% expected. Core inflation printed 2.6% against 2.5%. Small misses, but in the wrong direction, and only a month after the Fed raised rates by 25 basis points for the first time in more than three years.
Bitcoin dropped up to 2.3% on the release, to around $81,500. The next day the PPI came in at 6.3% year over year, and BTC briefly slipped under $80,000 before climbing back toward $82,000. As of Monday, October 19, it sits around $82,700.
Chart 1: Bitcoin against the US 10-year yield
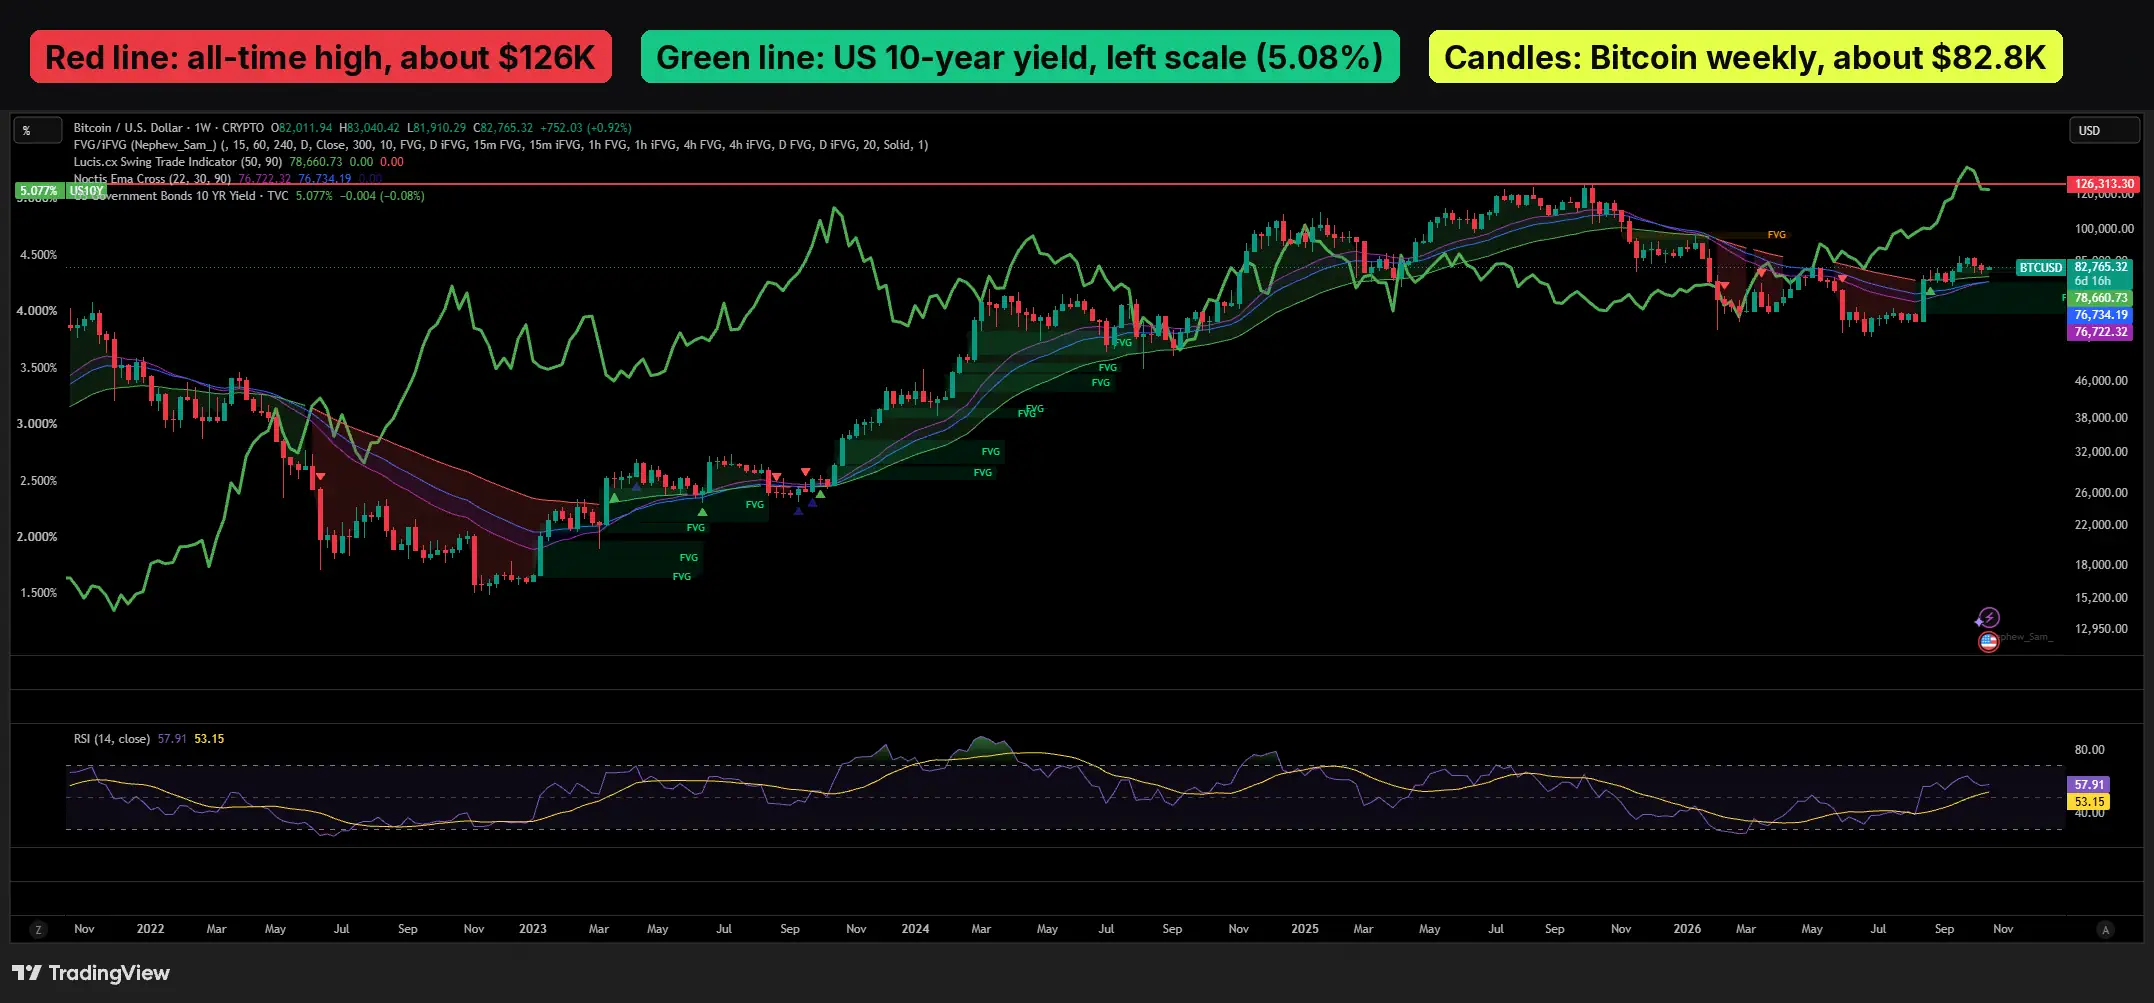
BTCUSD weekly from my TradingView, with the US 10-year Treasury yield overlaid (green line, left scale). Snapshot taken October 19, 2026.
This is the first chart I open every morning. Three things on it:
The red line is the all-time high, around $126,300, set in October 2025. Price is now about 35% below it.
The green line is the US 10-year yield, around 5.08%. It has climbed hard since the summer.
The candles are Bitcoin on the weekly. Since the top, it has been chopping in a wide range and has not taken back $100,000.
When the 10-year climbs this fast, money gets paid more to sit in Treasuries, and assets like Bitcoin have to fight for every dollar. It's not a rule I trade blindly. I use it as a pressure gauge. A hotter CPI keeps that pressure on, and Bitcoin reacted the same day. That's the link I want you to see.
Why I always start with Bitcoin
BTC first. Then ETH. Then the rest.
Bitcoin dominance today: around 60.75%
Bitcoin leads. When BTC is unstable, the rest rarely holds up on its own. ETH trades around $2,430, and I read it after Bitcoin, never before. If Bitcoin can't find its footing, I don't go hunting in altcoins.
Chart 2: TOTAL3, where I wait for altcoins
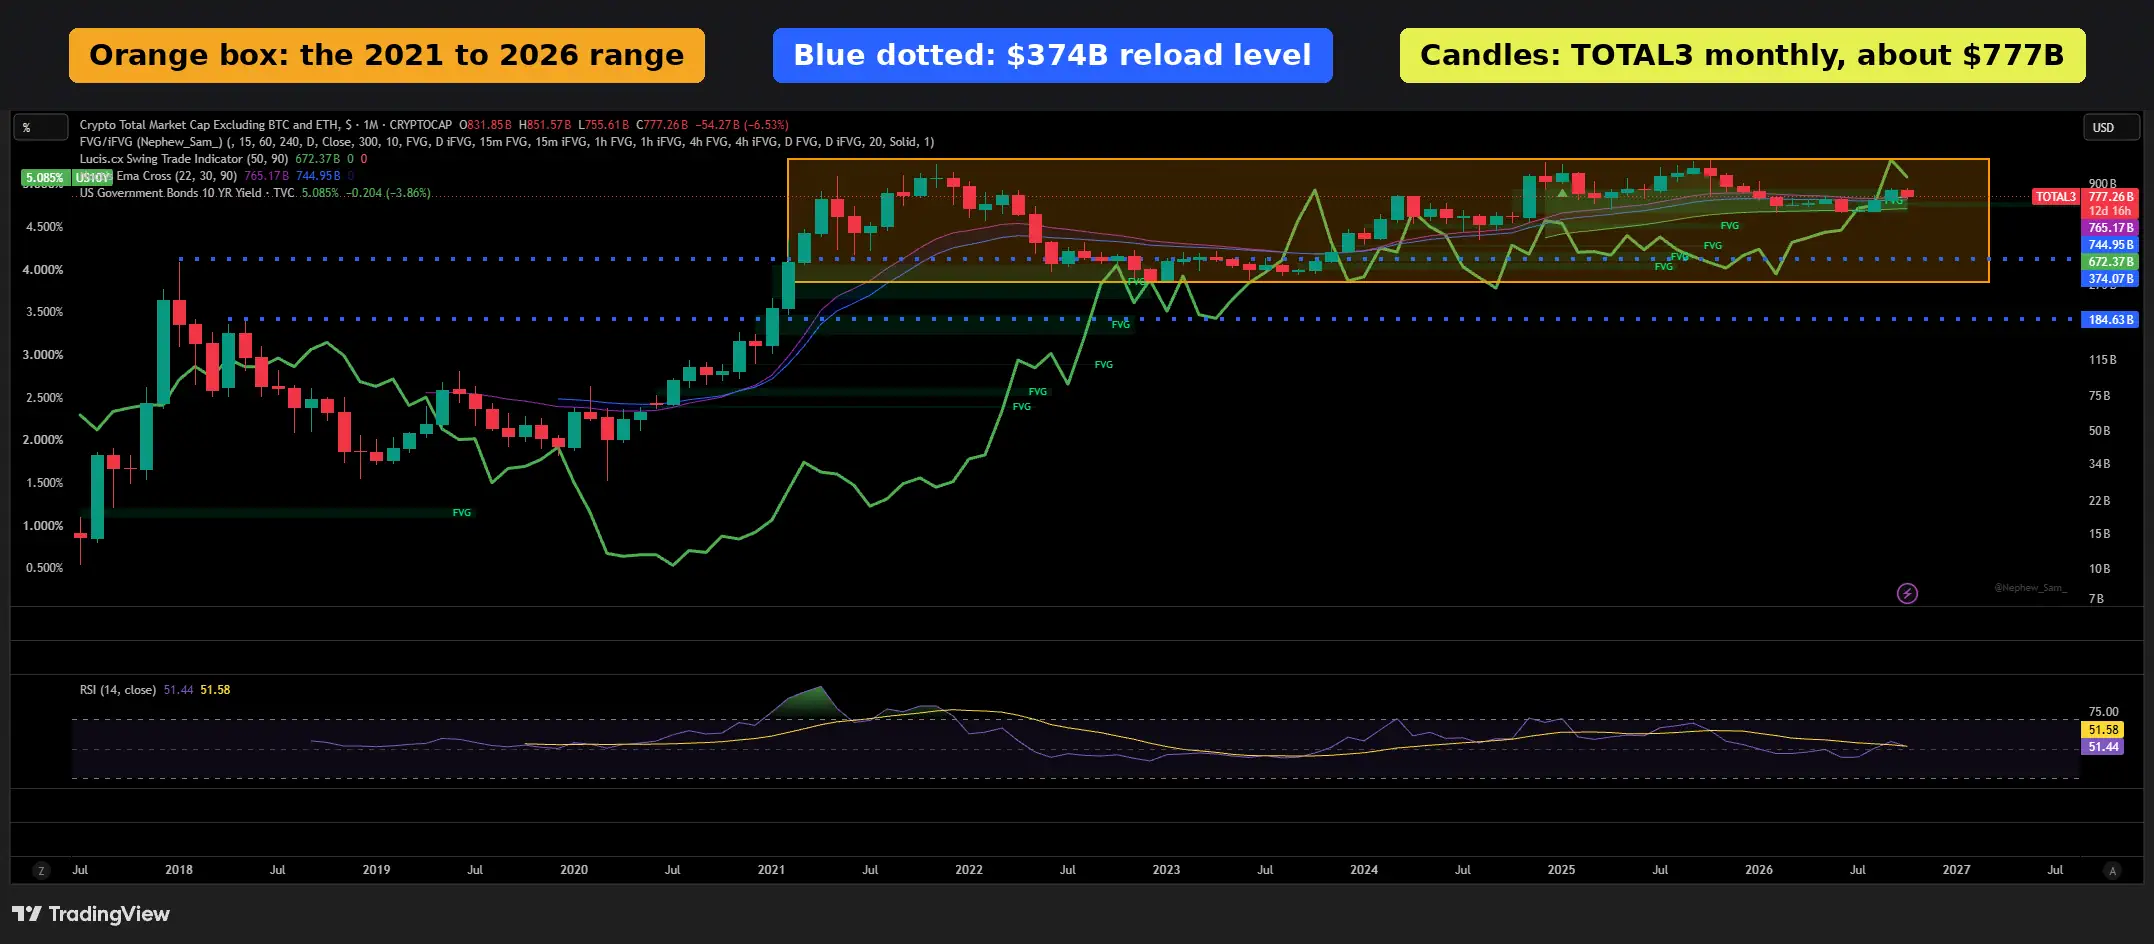
TOTAL3 (total crypto market cap excluding BTC and ETH), monthly, from my TradingView. Snapshot taken October 19, 2026.
TOTAL3 is the market cap of everything except Bitcoin and Ethereum. It's the cleanest way I know to see what altcoins are doing as a group.
The orange box is the range altcoins have been stuck in since 2021. Price has tested the top several times and never held above it.
The blue dotted line at $374B is my reload level. It's the 2018 high, and price spent most of 2022 and 2023 sitting on it. When an old top turns into a floor like that, I pay attention.
Today TOTAL3 is around $777B, in the middle of the range, roughly double that level.
The middle of a range is where I do the least. My order doesn't change because of one CPI print: Bitcoin first, then ETH, then TOTAL3. If altcoins ever come back to the $374B zone, that's where I'll study them again, with a stop and a position size I can live with. Until then, I watch.
What I'm watching next
The Fed meeting on October 27 and 28. After the September hike, the market will listen for whether another one is on the table.
The US 10-year yield. If it keeps pushing above 5%, I expect Bitcoin to keep struggling. If it rolls over, the pressure eases.
Bitcoin's weekly close. One day doesn't tell me much. The weekly candle does.
This article is educational content, not financial advice. Trading crypto carries a high risk of loss. Past performance, including mine, does not guarantee future results. Always do your own analysis.
Chris, ChartLab