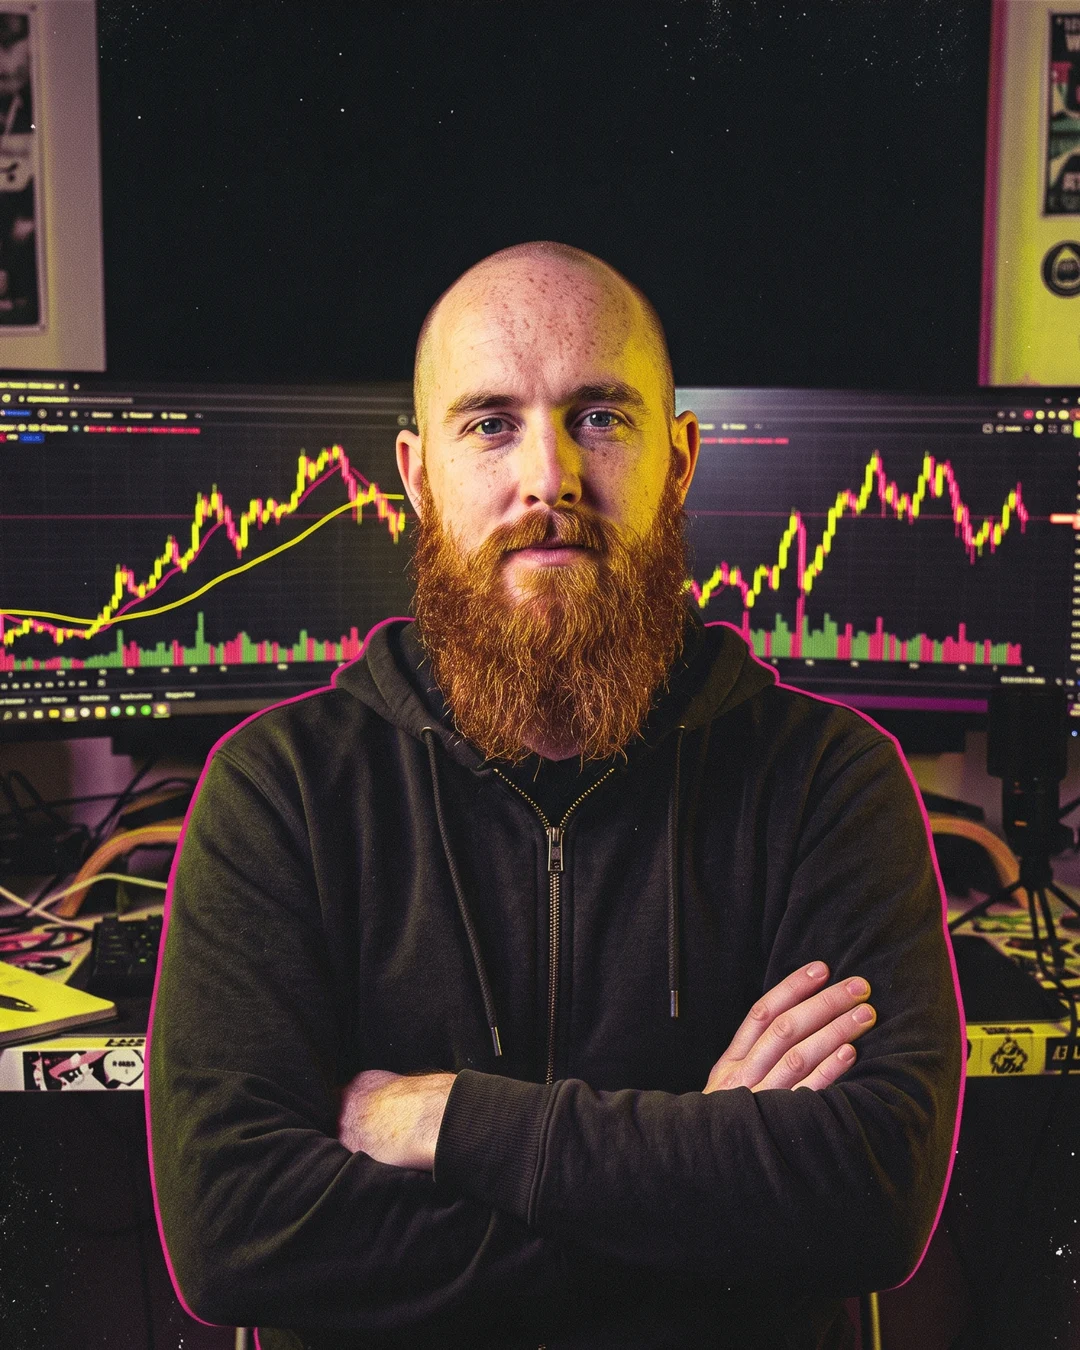
¿Quién es Chris? El trader detrás de ChartLab
De comprar DOGE soñando con un x1000 a perder el 33 % siguiendo a un gurú: cómo aprendí a leer los gráficos de Bitcoin por mí mismo, y por qué ChartLab te enseña a hacer lo mismo.
Real Bitcoin chart reads by Chris, every week. My own charts, my own levels, dated and public. No signals: learn to read the chart yourself.
De comprar DOGE soñando con un x1000 a perder el 33 % siguiendo a un gurú: cómo aprendí a leer los gráficos de Bitcoin por mí mismo, y por qué ChartLab te enseña a hacer lo mismo.
Du DOGE acheté pour un x1000 aux 33 % perdus en suivant un gourou : comment j'ai appris à lire les graphiques Bitcoin moi-même, et pourquoi ChartLab t'apprend à faire pareil.
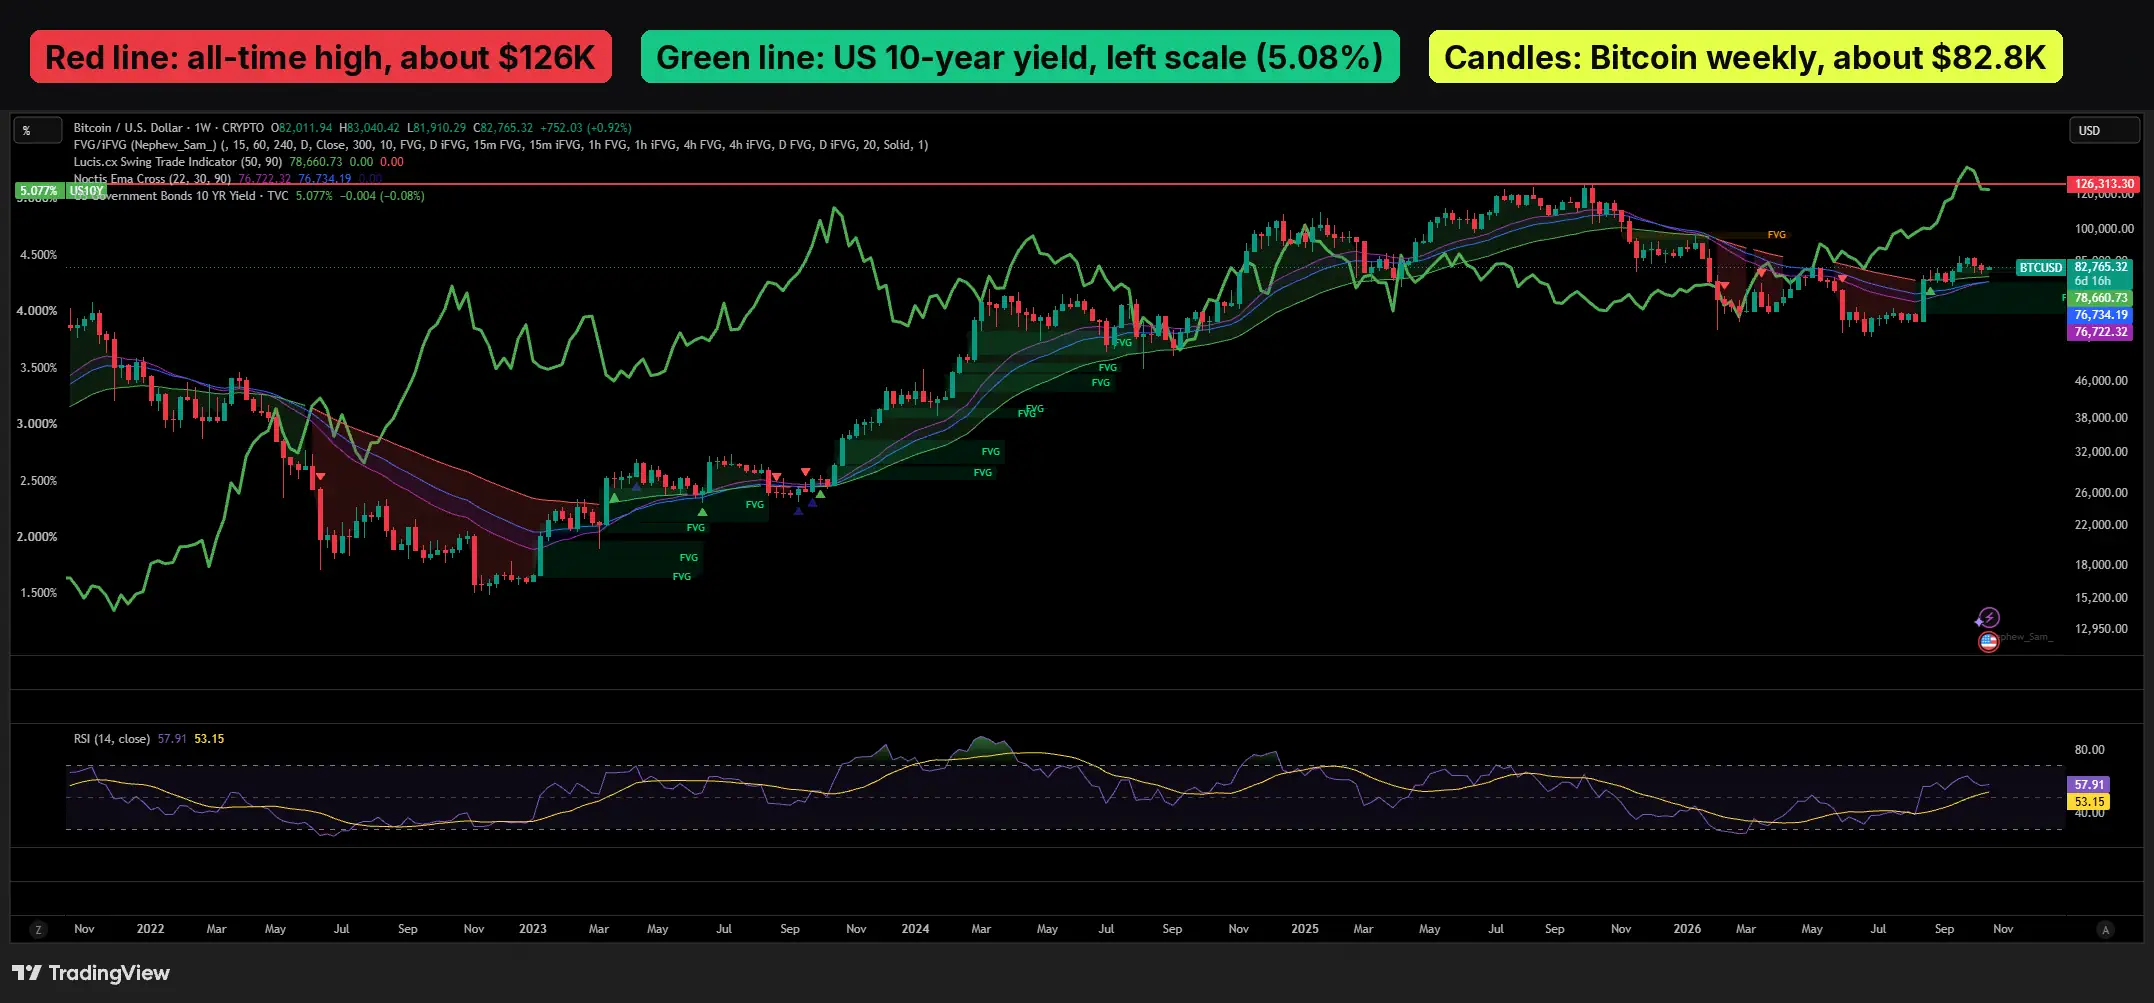
Gráficos reales de mi TradingView: Bitcoin frente al bono de EE. UU. a 10 años, por qué BTC manda y el nivel de TOTAL3 que espero en las altcoins. Educativo, sin señales.
De vrais graphiques de mon TradingView : le Bitcoin face au taux US à 10 ans, pourquoi le BTC mène, et le niveau TOTAL3 que j'attends sur les altcoins. Éducatif, sans signaux.
Real charts from my TradingView: Bitcoin vs the US 10-year yield, why BTC leads, and the TOTAL3 level I wait for on altcoins. Educational, no signals.
From buying DOGE for a 1000x to losing 33% following a guru: how I learned to read Bitcoin charts myself, and why ChartLab teaches you to do the same.